What Is OEE? A Plain-English Guide for Plant Teams
OEE gets explained with formulas and pyramids and consultant slides. Here's the version we give to a supervisor on their first day: what the number means, and what it doesn't.

Ask three people in the same plant what OEE means and you'll usually get three answers. The maintenance lead says it's about uptime. The quality manager says it's about rejects. The plant manager says it's the number on the monthly report that corporate keeps asking about.
They're all partly right, which is exactly the problem. So here's the explanation we actually use with new supervisors, without the consultant slides.
The one-sentence version
OEE answers a single question: of all the time you planned to run this machine, how much of it produced good product at the speed the machine is capable of?
That's it. Everything else — the formulas, the three factors, the loss categories — is just bookkeeping in service of that question.
The three factors, in the order losses actually happen
OEE is the product of three percentages, and it helps to think of them as three gates your production time has to pass through.
Availability asks: was the machine running when it was supposed to be? You planned an 8-hour shift. The filler was down 90 minutes — a jam, a breakdown, waiting on material. You ran 6.5 of 8 hours, so Availability is 81%.
Performance asks: while it was running, was it running at full speed? Your case packer is rated for 40 cases a minute but it actually averaged 32, because of worn belts and a dozen little slowdowns nobody logged. That's 80% Performance.
Quality asks: of what you made, how much was good the first time? You produced 12,000 units and 300 got rejected or reworked. That's 97.5% Quality.
Multiply them: 0.81 × 0.80 × 0.975 = about 63% OEE. Which means that of the shift you paid for, you got 63% of it back as sellable product at rated speed.
That multiplication is why OEE numbers feel brutally low the first time a plant measures honestly. Three factors that each look respectable on their own — low 80s, low 80s, high 90s — compound into a number in the low 60s. Nothing is broken. That's just what the math does, and it's the point: small losses stack.
What OEE is genuinely good for
The number itself matters less than what sits underneath it. A 63% OEE tells you almost nothing. But knowing that Availability is your weak leg — and that 40 of those 90 down minutes were "waiting for material" rather than breakdowns — tells you exactly which conversation to have, and it isn't with maintenance.
OEE is at its best as a sorting tool. It takes a vague feeling ("that line struggles") and splits it into three directions you can actually walk: the machine stops too much, the machine runs slow, or the machine makes scrap. Different problems, different owners, different fixes.
It's also good for tracking whether a change worked. You rebalanced the labeler and cut changeover steps — did Availability actually move over the next two weeks, or did it just feel faster?
What OEE is not
A few things worth saying plainly, because they cause most of the damage when OEE programs go wrong.
OEE is not a grade for operators. The operator didn't choose the changeover procedure, the maintenance backlog, or the material that arrived late. When the number gets used in performance reviews, people stop recording downtime honestly, and then the number is worthless. We've written more about that in why operators stop logging downtime.
OEE is not comparable between plants, and usually not even between lines. A slow, stable line making one product all week will post a higher OEE than a flexible line doing six changeovers a day — and the flexible line might be the more profitable one. Compare a line against itself, last month against this month. That comparison is honest. Most others aren't.
And 100% is not the goal. 100% OEE means no changeovers, no maintenance, no trials of new products, ever. A plant improving its OEE from 62 to 68 over six months has done something real. A plant reporting 92 has usually just defined its losses out of the calculation.
Where to start
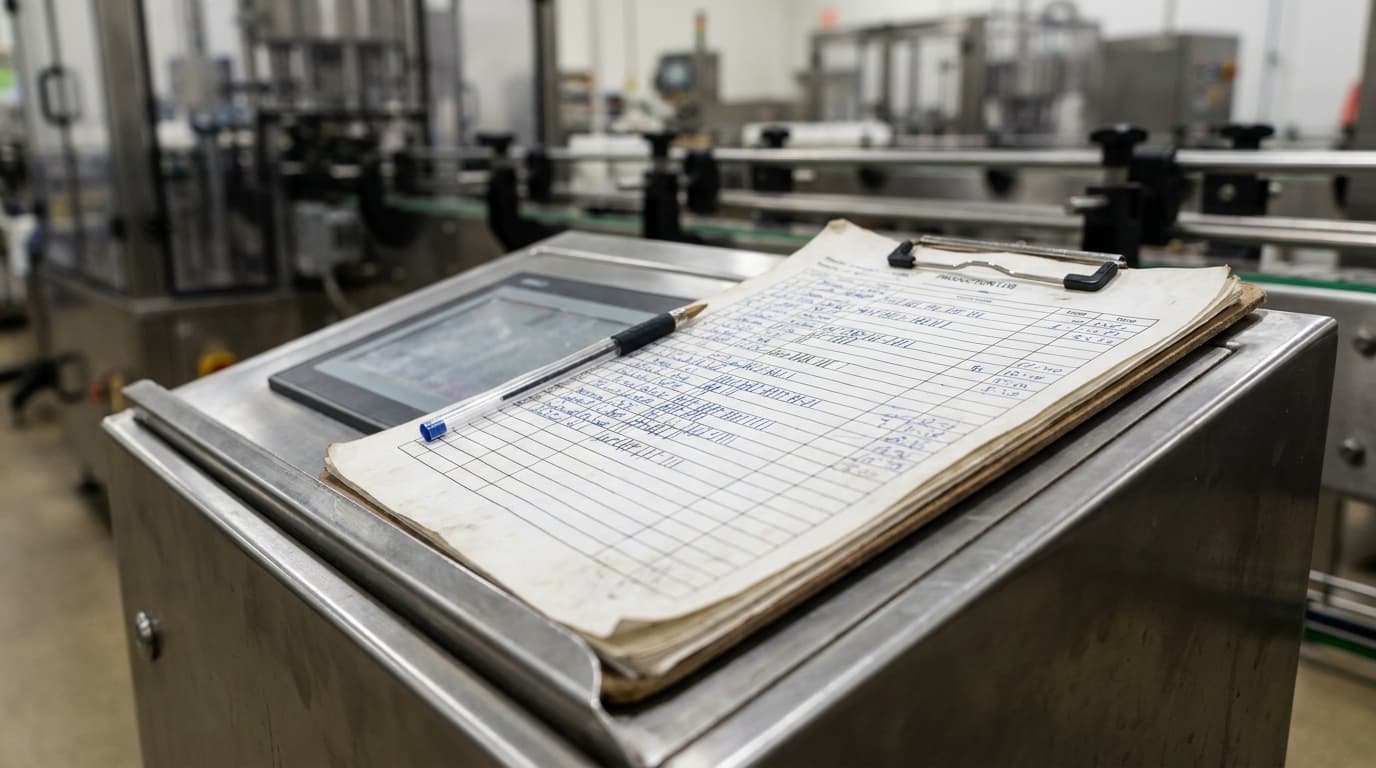
You don't need sensors, integrations, or a six-month project. You need planned production time, a count of good units, a rated speed you believe, and a record of stops with reasons. A supervisor with a clipboard can produce a real OEE number for one line in a week — and that first honest number, low as it will be, is worth more than a year of polite estimates.
Start with one line. Measure it honestly. Argue about the reasons, not the number. The improvement part comes later, and it comes a lot easier once everyone trusts what they're looking at.