How to Calculate OEE, Walked Through a Real Shift
The OEE formula takes thirty seconds to learn. The judgment calls — what counts as planned time, which speed to use, where changeovers go — are where every plant gets tangled. Let's walk one shift all the way through.
The OEE formula fits on a sticky note: Availability × Performance × Quality. What doesn't fit on a sticky note is the string of judgment calls you make on the way there — and those calls, not the arithmetic, are why two people can calculate OEE for the same shift and land eight points apart.
So let's do one shift, start to finish, with the awkward parts left in.
The shift
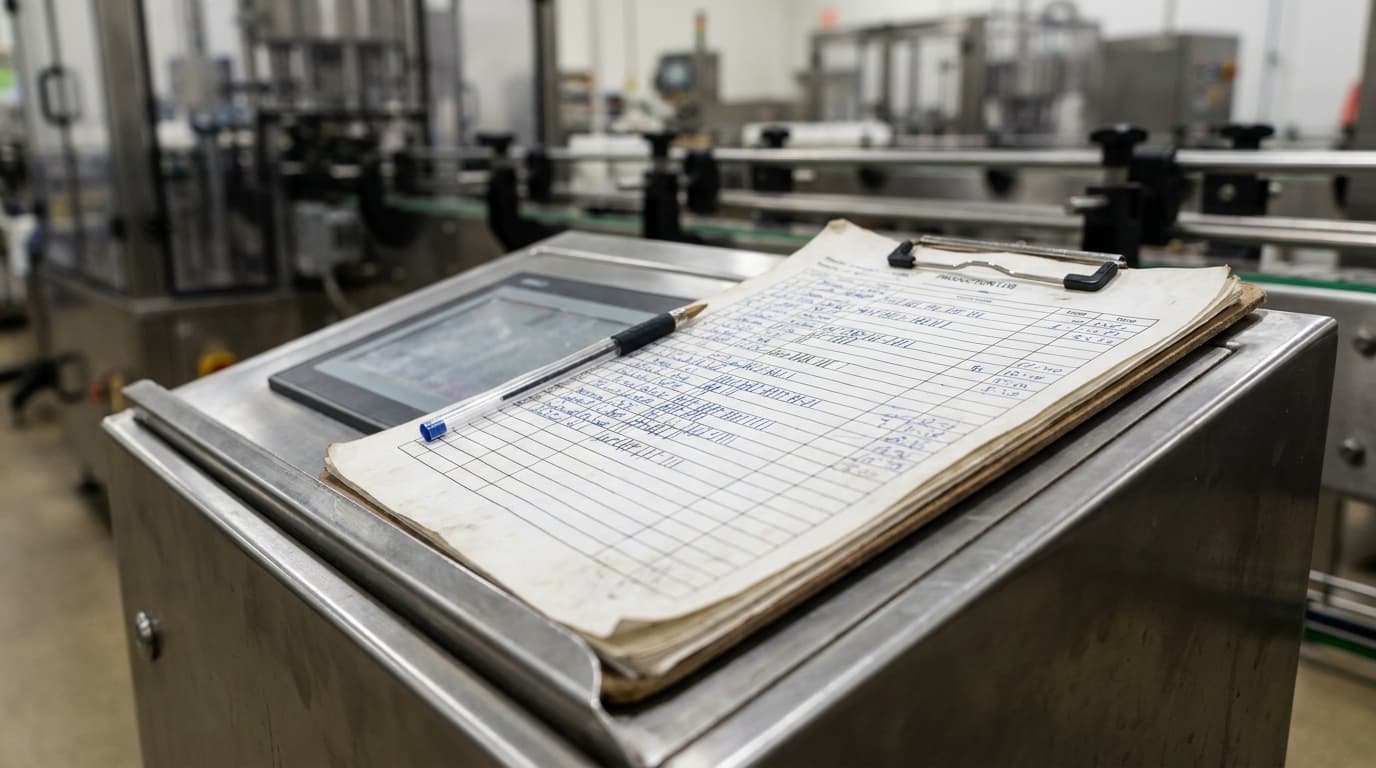
A bottling line, Tuesday day shift, 6:00 to 14:00. Here's what the log sheet says:
- 30-minute lunch break, line stopped, as scheduled
- 45-minute changeover from 500ml to 1L bottles
- Filler jam, 25 minutes
- Cap feeder ran empty twice, about 10 minutes total
- Rated speed for the 1L product: 200 bottles/minute
- Total bottles produced: 61,000
- Rejects (underfill and bad caps): 1,400
Step 1: Planned production time
Shift length is 480 minutes. The lunch break is time you never intended to produce during, so it comes out before anything else: 480 − 30 = 450 minutes of planned production time.
This is the first judgment call, and it matters more than people expect. Whatever you exclude here can never show up as a loss. Exclude too much — breaks, meetings, cleaning, "scheduled" this and that — and you've quietly decided those hours are free. Our rule of thumb: exclude only what you'd still exclude if the plant were trying its absolute hardest. Lunch qualifies. A daily 40-minute "scheduled cleanup" that a better-organized crew does in 15 probably shouldn't.
Step 2: Availability
Now subtract the stops. Changeover (45) + filler jam (25) + cap feeder (10) = 80 minutes of downtime.
Run time = 450 − 80 = 370 minutes. Availability = 370 / 450 = 82.2%.
The changeover is the argument everyone has. It's planned — you knew it was coming — so shouldn't it come out of planned time like lunch did? Our answer is no, and here's why: changeover time responds to improvement. You can stage tools, pre-set the labeler, run a SMED exercise, and take that 45 minutes to 20. If you define it out of the calculation, you've hidden your biggest improvement opportunity in the one place OEE can't see it. Planned doesn't mean free. It means scheduled.
(Keep it as its own reason code, though. A shift lost to changeovers and a shift lost to breakdowns need entirely different fixes, and a single "downtime" bucket hides that.)
Step 3: Performance
At rated speed, 370 minutes of run time should have produced 370 × 200 = 74,000 bottles. The line actually made 61,000.
Performance = 61,000 / 74,000 = 82.4%.
The judgment call here is which speed to use. It has to be the rated speed for this product on this line — the 1L bottles run slower than the 500ml, and using the wrong one will make Performance nonsense. And resist the temptation to use a "realistic" speed that the line comfortably achieves. The gap between rated and actual is the whole point of the number; a comfortable target erases it. If you genuinely don't know the rated speed, use the best sustained rate the line has ever demonstrated, and write down which you chose.
Notice what Performance is quietly collecting: all the losses too small to log. Nobody wrote down a stop for the labeler hesitating or the conveyor bunching up, but 13,000 missing bottles say those micro-stops happened. Performance is where unrecorded downtime goes to hide.
Step 4: Quality
Of 61,000 bottles, 1,400 were rejected. Good count = 59,600.
Quality = 59,600 / 61,000 = 97.7%.
One convention to settle up front: rework. If underfilled bottles get emptied and re-run, they still count as quality losses the first time through — first-pass yield, not eventual yield. Otherwise rework looks free, and rework is never free.
Putting it together
OEE = 0.822 × 0.824 × 0.977 = 66.2%.
Of the 450 minutes you planned, you got about 298 minutes of value back. And the breakdown tells you where the rest went: roughly 80 minutes to recorded stops, about 72 minutes' worth to speed losses, and around 7 to rejects.
That last sentence is the real product of the calculation. Not the 66 — the ranking. On this line, on this shift, the changeover and the invisible speed losses dwarf everything else. That's where Tuesday's improvement conversation should start.
Do the same math the same way every shift, and in a month you'll have something no formula can give you: a trend you actually trust.