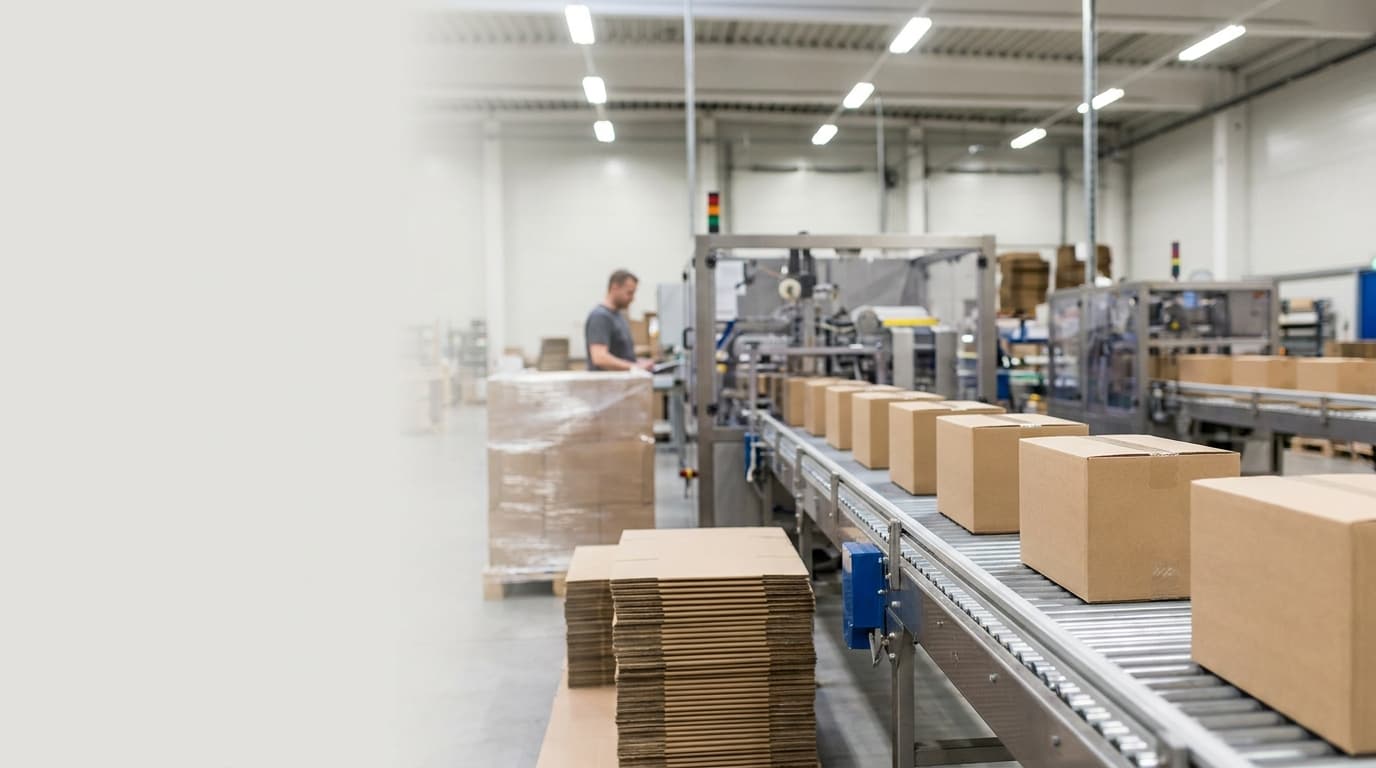
 For Packaging Lines
Film breaks and seal defects, tracked the moment they happen.
Flow wrappers, cartoners, case packers, and palletizers each fail differently — EnicSoft OEE ships with a downtime tree that already knows the difference between a film web break, a carton feeder empty, and a palletizer robot fault, so operators aren't inventing categories on the fly.
Film and carton handling
Film roll changes, web breaks, and carton feeder empties are tracked as distinct reasons — see which one actually dominates your downtime.
Seal quality, not just "reject"
Weak seals and wrinkled film are broken out from generic quality rejects, pointing straight at a tooling or tension issue instead of a mystery reject pile.
Multi-machine lines
Track wrapper, cartoner, and case packer as separate machines on one line, so you know exactly which station is the actual bottleneck, not just the line as a whole.

Everything a plant floor needs, nothing it doesn't.
Built around the three numbers that actually run a manufacturing shift.
Real-Time OEE Dashboard
Availability, Performance, Quality, and OEE are calculated live from every sensor pulse — not batched at the end of the day.
Downtime Tracking & Classification
Every stoppage is logged automatically and categorized as planned or unplanned, so losses are never a mystery.
Force Stop & Shift Management
Wrap up a shift the moment the production plan is done — remaining scheduled time is excluded from OEE automatically.
Multi-Line, Multi-Shift
Configure shifts per line and timezone, then track performance across your entire plant floor from one place.
Reports & Exports
One-click OEE and downtime reports, ready to export and share with leadership — no spreadsheet wrangling required.
Role-Based Access
Operators, shift leaders, and management each get exactly the permissions they need — nothing more, nothing less.
Energy & Vampire Load Tracking
Track live power draw per machine. Automatically flag 'Vampire Load' — energy wasted by idle machines drawing power during stoppages.
Carbon Footprint Monitoring
Calculate Scope 2 CO2 emissions per shift and per unit produced, using live grid emission factors linked to your utility tariffs.
Time-of-Use Cost Analysis
Split energy expenses dynamically into peak and off-peak hour rates, helping shift leaders align high-draw runs with lowest rates.
From sensor pulse to shift report in three steps.
Connect your sensors
Machines send production pulses to a single ingestion endpoint. No new hardware standard required — plug into what's already on the line.
Watch performance live
Availability, Performance, and Quality update in real time on the dashboard, with downtime automatically classified as it happens.
Report and improve
Export shift, daily, or custom-range OEE reports and hand leadership the numbers they need to fix the next bottleneck.
Ready to see your real OEE?
Tell us a bit about your plant floor and we'll show you EnicSoft OEE running on your own numbers.